
TL;DR:
- Established creators often focus on surface metrics like follower counts and views, but these do not predict revenue accurately. Understanding and optimizing core metrics such as RPM, retention, conversion, and lifetime value are essential for meaningful growth. Embedding a structured analytics workflow into daily operations and leveraging professional management maximizes long-term revenue and fan loyalty.
You’re earning $3k or more a month, your content is strong, and your audience is growing. But here’s the problem most established female creators eventually hit: the numbers you’re watching are not the ones that actually drive revenue. Follower counts, likes, and raw view totals feel meaningful, but they rarely predict what pays you next month. The role of analytics in creator management goes far deeper than a follower dashboard. This guide breaks down exactly which metrics matter, how to capture behavioral data that reveals real fan intent, and how to build an analytics process that keeps your revenue growing month after month.
| Point | Details |
|---|---|
| Focus on RPM | RPM is your most reliable metric for understanding revenue efficiency across all income streams. |
| Instrument retention | Measuring watch-time and running cohort analyses guides effective fan retention improvements. |
| Use incrementality-aware reporting | Standard attribution tools often undervalue your contributions, so use advanced measurement methods. |
| Analytics is operational | Treat analytics as an ongoing system integrated with creative decision-making, not just reports. |
| Balance metrics | Separate engagement, monetization efficiency, and monetization depth to avoid short-sighted optimizations. |
Before you can act on data, you need to speak its language. Many creators track what’s easy to find rather than what’s genuinely useful. That’s where the confusion starts.
The two metrics that trip up creators most are RPM (Revenue Per Mille) and CPM (Cost Per Mille). They sound similar, but they measure completely different things. RPM is total earnings per 1,000 views across every revenue source, including subscriptions, tips, pay-per-view content, and ads. CPM, by contrast, only reflects what advertisers pay per 1,000 ad impressions. If you’re optimizing for CPM, you’re only looking at one slice of your income. RPM shows you the full picture.
Why does this matter? Because two pieces of content can have identical CPMs and wildly different RPMs, depending on whether they trigger fan purchases, subscription upgrades, or tips. RPM is the metric that ties directly to your actual bank balance. Understanding creator monetization basics gives you the foundation to build from there.
Key metrics every established creator should track:
Several factors shape your RPM beyond content quality alone: audience geography (U.S. viewers typically generate higher RPM than international audiences), content category, video or post length, and how well your content is aligned with your monetization strategy.
Pro Tip: Stop chasing high CPM categories just because other creators do. Focus on improving RPM by creating content that drives direct fan payments, not just ad impressions.
Knowing the right metrics is step one. Knowing how to collect and act on them is where most creators fall short.
Mature creator analytics starts by defining one to three core business KPIs, then building a funnel that tracks fan behavior from first discovery all the way through to a paying action. Without this structure, you’re guessing.
Here’s how to build your behavioral analytics funnel:
Behavioral signals to prioritize:
Pairing this data with strong fan retention strategies and knowing how to manage creator accounts effectively turns individual data points into a repeatable revenue system.
Pro Tip: Watch time and completion rate are far more sensitive signals than view counts. If fans are dropping off at the 30% mark consistently, that’s not a promotion problem. It’s a content problem. Fix the content first.

If you work with brand partners or plan to, the measurement landscape just changed significantly, and understanding it protects your negotiating position.
Historically, brand deals relied on follower counts as a proxy for audience size and value. That era is ending. Brands can now access deeper first-party viewership data through YouTube’s Creator Partnership API, which lets partners evaluate creators based on who actually watches, not just who follows. This is a meaningful shift. A creator with 200,000 followers and a highly engaged niche audience can now outperform a creator with 1 million followers and low watch time, in the data brands see.
But there’s a risk on the other side of this shift. Standard attribution tools risk cutting 40% of top creators from brand deals because they undercount conversions using last-touch attribution models. Last-touch attribution gives full credit to whichever channel a buyer clicked right before purchasing, ignoring every creator touchpoint that built the trust leading up to that click.
What this means for your creator management strategy:
“Creators whose impact is measured only by last-touch conversion data are consistently undervalued. Media Mix Modeling and other incrementality-aware approaches reveal the true revenue lift that content creators drive across the full buyer journey.”
Media Mix Modeling (MMM) estimates each channel’s true contribution to revenue over time, rather than crediting only the final click. Knowing this exists lets you advocate for fairer measurement in your brand negotiations. Reviewing creator management best practices can help you build a stronger overall case when entering these conversations.
Data without action is just a report. The creators who grow consistently are the ones who embed analytics into a repeatable workflow, not just a monthly check-in.
Data-driven decision-making is a continuous workflow: define the problem, capture the data, build a dashboard, translate insights into action, train the right people on execution, and monitor outcomes so you can iterate. That cycle, done consistently, compounds over time.
The analytics operations loop in practice:
Common analytics mistakes to avoid:
Combining this workflow with advanced social media marketing and a focused plan for scaling creator revenue creates a compounding growth engine rather than a cycle of random content experiments.
Pro Tip: Schedule a monthly “decision review” where you ask one question: what content or monetization decision did you make this month based on data? If the answer is none, your analytics process isn’t connected to your creative workflow yet.
One of the most practical things you can do for your creator business is stop treating all metrics as interchangeable. Three distinct categories shape your revenue, and confusing them leads to real money left on the table.
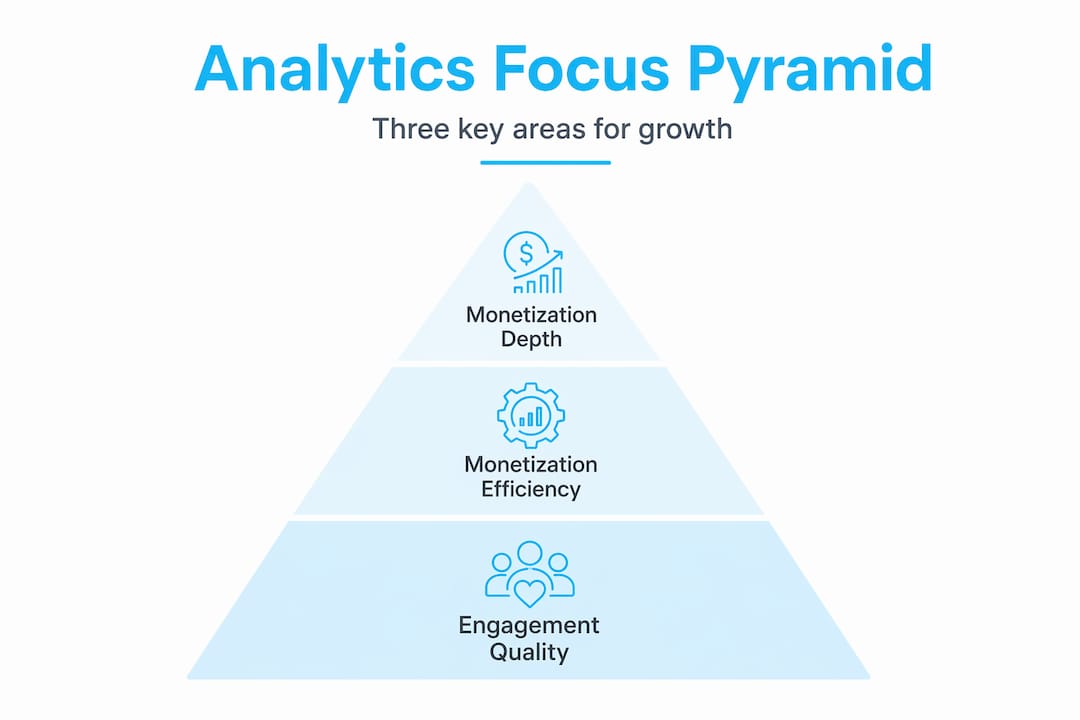
Tracking these three areas separately prevents the trap of optimizing only surface metrics like views while missing deeper monetization signals.
| Metric category | What it measures | Key analytics method |
|---|---|---|
| Engagement quality | Retention rate, watch time, comment depth | Cohort analysis, completion rate tracking |
| Monetization efficiency | RPM, revenue per subscriber | Revenue dashboards, RPM trend tracking |
| Monetization depth | Fan payments over time, LTV, upsell rate | Subscriber lifetime tracking, purchase history |
Here’s why the distinctions matter in practice. A creator who optimizes purely for views can drive strong engagement quality but still earn low RPM if the content doesn’t lead fans toward paid actions. A creator who focuses only on subscription revenue may see high monetization efficiency but miss the monetization depth that comes from tips, pay-per-view, and fan gifts.
Actionable steps to balance all three areas:
Building deeper fan relationships is the underlying force that improves all three categories simultaneously. When fans feel genuinely connected to you, they watch longer, convert more readily, and pay more over time.
Here’s a perspective that most analytics guides skip entirely: the problem isn’t that creators lack data. Platforms give you more data than you can reasonably act on. The real problem is that most creators treat analytics as a reporting activity rather than an operating system built into their business.
Analytics fails when teams stop at dashboards without execution and iteration. Checking your stats on Sunday night and feeling informed is not the same as making a content decision on Monday morning because of what the data told you.
The creators we see growing consistently share one habit: they tie every major creative decision to a specific data question. Not “let me check how last week went,” but “I want to know whether the new messaging format is improving my 60-day retention, so I’m running this test for six weeks and reviewing it on a fixed date.”
That shift from passive reporting to active experimentation is what the automation and analytics synergy conversation is really about. Automation handles the repetitive execution. Analytics tells you what to automate and where to focus human creativity.
Role clarity matters here too. When you’re running your creator business solo, every role falls on you: content creation, fan engagement, marketing, and data analysis. That’s an impossible combination if you want to use analytics well. The analysis role requires focused thinking time, not multitasking. Delegating execution, whether that’s chat management, scheduling, or reporting setup, creates the mental space to actually act on what your data reveals.
Pro Tip: Once a month, challenge your own dashboard by asking: “What would I do differently if this number was 20% lower?” If you can’t answer that, the metric isn’t actionable enough to be worth tracking.
You’ve now seen how much goes into building and sustaining a real analytics process. Defining KPIs, running experiments, separating engagement from monetization depth, and navigating brand measurement changes. That’s a full-time job layered on top of content creation.
At OnlyDreams Agency, we handle the operational side of your creator business so you can put your energy into creating. Our team sets up tailored KPI frameworks, manages analytics workflows, and builds the reporting structures that turn raw data into revenue decisions. We also provide 24/7 chat management that builds genuine fan relationships, which directly improves every engagement and monetization metric you’re tracking. Whether you’re ready to explore professional creator management services or want to start with creator management best practices, we’re here to help you build something that compounds.
RPM stands for Revenue Per Mille and measures total earnings per 1,000 views from all revenue sources combined, making it the most accurate indicator of your overall monetization efficiency, unlike CPM which only reflects ad revenue.
Creators can instrument watch-time at 25/50/75% completion points and run cohort analysis alongside A/B tests to identify which content changes genuinely improve retention and long-term subscriber value.
Follower counts no longer reflect real audience value; brands now evaluate creators using first-party viewership data showing who actually watches content, which shifts negotiating power toward creators with genuinely engaged audiences.
It’s a method like Media Mix Modeling that estimates true channel-level impact over time, correcting the conversion undercounting that standard last-touch attribution tools produce and that can cost creators brand deal renewals.
By treating analytics as an active workflow rather than a passive report: defining problems, capturing data, taking action on insights, maintaining role clarity, and iterating based on measured outcomes rather than stopping at a dashboard view.