
TL;DR:
- A goal-linked dashboard combining five retention KPIs, GA4 attribution, and chat diagnostics provides the most effective creator performance measurement system. Tracking operational costs, ownership, and weekly reviews ensures proactive management and accurate ROI calculation, supporting sustained growth. Only-dreams delivers comprehensive onboarding, dashboards, and ongoing analysis to help creators scale confidently with data-driven decision-making.
The most effective way to measure creator performance is a goal-linked dashboard that combines five retention-and-revenue KPIs, chat sales diagnostics, and GA4-powered attribution. Set it up once, review it weekly, and you have a system that catches problems before they cost you subscribers.
TL;DR:
Immediate-action checklist:
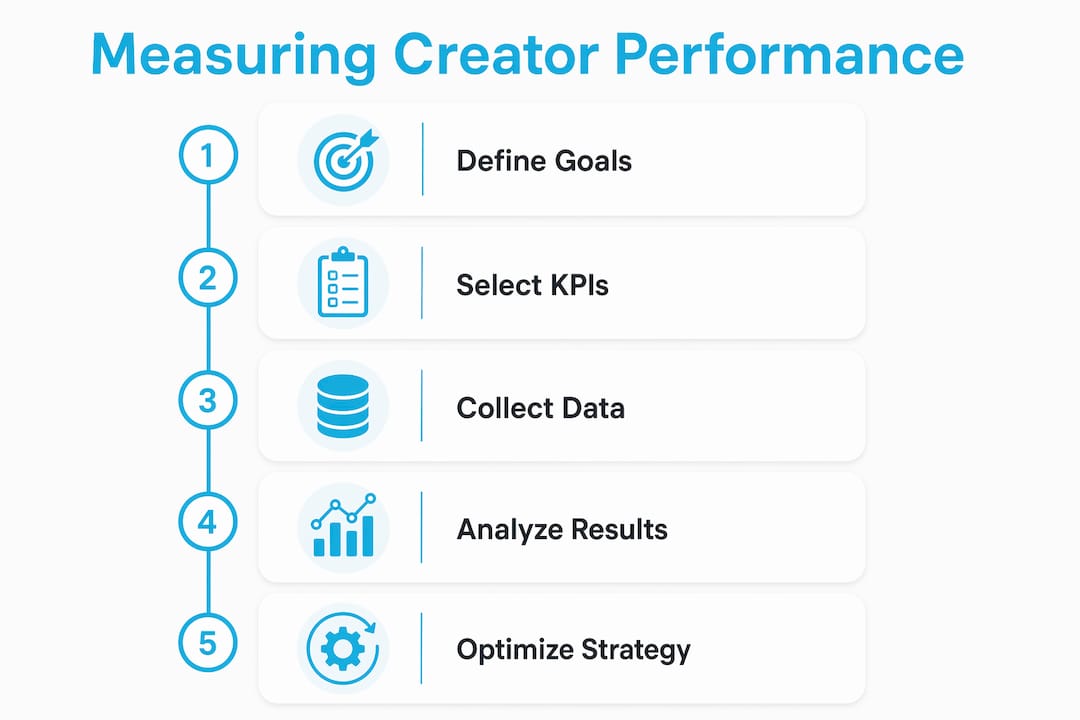
Start with the goal, not the metric. Every KPI you track should trace back to a specific business outcome.
| Business Goal | Primary KPI | Owner | Review Cadence |
|---|---|---|---|
| Grow subscription MRR | Net subscriber growth + churn rate | Account manager | Weekly |
| Raise DM revenue share | Chatting ratio (DM rev : sub rev) | Chat lead | Weekly |
| Reduce first-month cancellations | 30-day retention rate | Account manager | Weekly |
| Increase per-fan value | Revenue per fan (RPF) | Account manager | Monthly |
| Recover lost subscribers | Winback conversion rate | Chat lead | Monthly |
Pick targets against your own baseline first, then compare to benchmarks. Assigning ownership matters: if nobody owns a KPI, nobody fixes it when it drops.
Pro Tip: Define one north-star KPI (usually RPF or MRR) and one operational health KPI (usually churn rate). Two numbers are easier to defend in a weekly call than twelve.
Five retention KPIs create a complete picture of account health. Here are the formulas and target ranges:
| KPI | Formula | Target Range | Alert Threshold |
|---|---|---|---|
| Monthly churn rate | Cancellations ÷ active subs | 8–15% | Above 20% |
| Subscriber LTV | Avg monthly RPF × avg lifetime months | Varies by niche | Declining MoM |
| 30-day retention | Subs active at day 30 ÷ new subs | 25–45% | Below 45% |
| Revenue per fan (RPF) | Gross revenue ÷ active subscribers | $25–60 | Below $15 |
| Winback conversion | Winback subs ÷ total lapsed contacts | Varies by window | Track by 30/60-day cohort |
Supplemental engagement metrics that feed those KPIs:
Three common pitfalls:
Cohort analysis detects retention problems about six weeks earlier than aggregate metrics. Run a monthly cohort view alongside your weekly aggregate dashboard.
True ROI includes every dollar you spend to generate revenue, not just content costs.
Formula:
ROI = (Incremental Revenue − Total Operational Costs) ÷ Total Operational Costs × 100
Worked example (monthly):
| Revenue Item | Amount |
|---|---|
| Subscription revenue | $5,000 |
| PPV + DM revenue | $3,950 |
| Total gross revenue | $13,000 |
| Cost Item | Amount |
|---|---|
| Total operational costs | $3,950 |
ROI = ($13,000 − $3,950) ÷ $3,950 × 100 = 229%
Cost-allocation checklist:
For A/B tests or pilot contracts, calculate breakeven: Breakeven revenue = Total operational costs ÷ (1 − platform fee). OnlyFans takes 20%, so divide costs by 0.80 to find the gross revenue you need to cover them.
On attribution: use a multi-touch model rather than last-click. A subscriber who saw an Instagram Reel, clicked a bio link, and then converted via a DM follow-up should credit all three touchpoints. For manager reporting, apply a conservative incrementality rule — only count revenue that moved above the pre-management baseline as attributable to the management engagement.
A reliable dashboard pulls from four source types. Here is the wiring plan:
| Data Source | What It Provides | Connection Method |
|---|---|---|
| OnlyFans / Patreon revenue export | Subscriptions, PPV, tips, churn | CSV export → Google Sheets |
| Google Analytics 4 | Post-click flows, DM attribution, traffic source | GA4 → Looker Studio connector |
| Payment processor (Stripe, etc.) | Net revenue after fees | API or CSV → Sheets |
| Chat platform logs | Response time, message volume, RPM | Manual export or API → Sheets |
Wire GA4 first. For Instagram DM funnels, UTM-tag every outbound link with utm_source=instagram and utm_medium=dm, then filter GA4 by those parameters to isolate DM-driven conversions. Instagram Insights does not track DM link clicks natively, so GA4 is the only reliable attribution layer.
Looker Studio dashboard: essential widgets
Data hygiene rules:
utm_campaign=ppv_june and utm_campaign=PPV-June are two different rows in GA4Refresh real-time alerts for churn spikes and PPV open-rate drops; aggregate daily and weekly for regular reviews. The role of analytics in creator management covers additional dashboard configurations specific to adult-content platforms.
Measurement without testing is just observation. Build experiments into your management plan from day one, because retrofitting measurement after a campaign ends produces unreliable results.
Three experiment templates:
Welcome-flow A/B test: Randomize new subscribers into two message scripts (variant A vs. variant B). Hold all other variables constant (posting frequency, PPV price, promotion). Measure PPV buy rate and 30-day retention per variant over a 30-day window.
Message-script uplift test: Split your active subscriber list into a treatment group (new DM script) and a holdout group (existing script). Run for 14 days. Measure revenue per message and reply rate. Require at least a 10% lift in RPM before rolling out the new script.
Segmented PPV offer test: Offer a discounted PPV to lapsed subscribers (no purchase in 30 days) while keeping the standard price for active buyers. Compare winback conversion between the offer group and a holdout.
Uplift measurement checklist:
For paid and organic unification, unified measurement connects creator credibility to long-term LTV rather than short-term vanity metrics. Use GA4 filtered views to separate paid traffic from organic, then compare RPF and LTV across both cohorts.
Chat performance is where subscription revenue either compounds or leaks. Track these metrics weekly:
| KPI | Benchmark | Alert Threshold |
|---|---|---|
| Chatting ratio (DM rev : sub rev) | 1:8 to 1:9 | Below 1:5 |
| Response time | Under 5 minutes | Over 15 minutes |
| PPV open rate | 25–45% | Below 15% |
| PPV conversion rate | 20–35% | Below 10% |

Response times under 5 minutes produce 3.2x higher PPV conversion compared to 15-minute response windows. That single metric is worth staffing for.
Staffing formula: Divide peak daily message volume by the number of messages a chatter can handle per hour (typically 40–60 for experienced chatters). That gives you required chatter-hours per shift. For a creator receiving 300 messages during a 4-hour peak window, you need at least 2 chatters on shift simultaneously.
QA scorecard components:
Flagging rules: Pause a script when PPV open rate drops below 15% for three consecutive days. Retrain a chatter when their individual RPM falls more than 30% below the team average. Escalate to the account manager when a subscriber raises a billing dispute or requests a refund. Professional chatters who follow these protocols consistently outperform unmanaged accounts on both RPM and retention.
Pro Tip: A chatting ratio below 1:5 usually means the chat team is under-scripted, not under-staffed. Fix the scripts before adding headcount.
Weekly reviewers reduce churn materially faster than monthly reviewers — 23% more effectively over 12 months according to agency data. Build your cadence around that finding.
Review cadence:
30/60/90-day benchmark ranges:
Share results with creators as a one-page dashboard screenshot plus three recommended next steps. Avoid raw data dumps — creators need signal, not spreadsheets.
Only-dreams builds measurement into the engagement from day one, not as an afterthought.
Onboarding checklist:
30-day pilot template:
Sample outcomes (anonymized):
Deliverables are shared via a Looker Studio dashboard (creator has view access), weekly written reports, and account manager notes. The creator owns the data. Only-dreams operates as a professional management partner with full transparency on every metric.
A goal-linked dashboard combining five retention KPIs, GA4 attribution, chat diagnostics, and weekly reviews is the most reliable system for measuring and scaling creator performance.
| Point | Details |
|---|---|
| Set goals before metrics | Map each business goal to one primary KPI with a named owner before tracking anything. |
| Five core retention KPIs | Track monthly churn, subscriber LTV, 30-day retention, RPF, and winback conversion weekly. |
| Include all operational costs | Agency fees, chat staffing, and software costs must be in your ROI denominator — 70%+ of creators omit them. |
| Chat ratio is the revenue signal | A chatting ratio below 1:5 signals underperforming scripts; target 1:8 to 1:9 for healthy accounts. |
| Only-dreams measurement model | Only-dreams delivers a baseline report within 7 days, Looker Studio dashboards, and weekly reports with creator data ownership. |
Most creators I work with arrive with one of two problems: they are tracking too much and acting on none of it, or they are tracking nothing and making decisions by gut. Both are expensive habits.
The conventional wisdom says “more data is better.” It is not. A dashboard with 40 metrics is a dashboard nobody reads. The five-KPI model works because it forces a choice: if a number is not on the dashboard, it is not a priority this week. That constraint is what makes weekly reviews sustainable instead of a 90-minute ordeal.
There is also a governance point that rarely gets discussed. Creators worry, reasonably, about handing data access to a management agency. The answer is not to avoid measurement — it is to structure data access so the creator retains ownership and the agency operates with view-only or scoped permissions. All data processed through Only-dreams is stored and handled within the United States, and creators retain full control of their platform accounts and GA4 properties throughout the engagement.
The measurement system described here is not a reporting exercise. It is the management infrastructure that makes every other decision faster and more defensible.
Only-dreams is the management agency for established creators who want their numbers to actually mean something. Where most agencies focus on content volume, Only-dreams starts with a baseline measurement audit: your current churn, RPF, chatting ratio, and attribution gaps, documented before a single script is written.
The creators who benefit most from this engagement:
Book a measurement audit with Only-dreams and get a baseline report within 7 days. No guesswork, no generic advice — just your numbers and a clear plan to move them.
Benchmark provenance note: Chatting ratio, RPM, and response-time conversion figures come from aggregated agency data across managed OnlyFans accounts. Platform-level statistics (first-month cancellation rates, PPV conversion ranges) are sourced from OnlyFans Course and OnlyTraffic analysis. Validate all benchmarks against your own account baseline before using them as targets.